



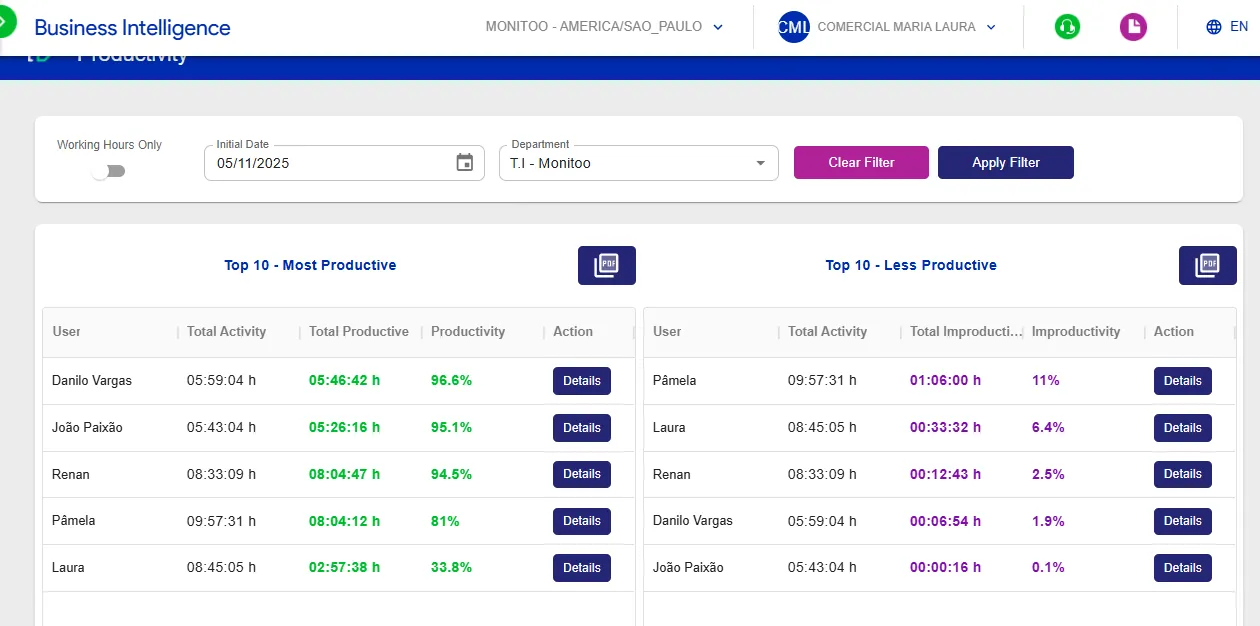
It allows you to visualize the Top 10 most productive and least productive users in the same department.
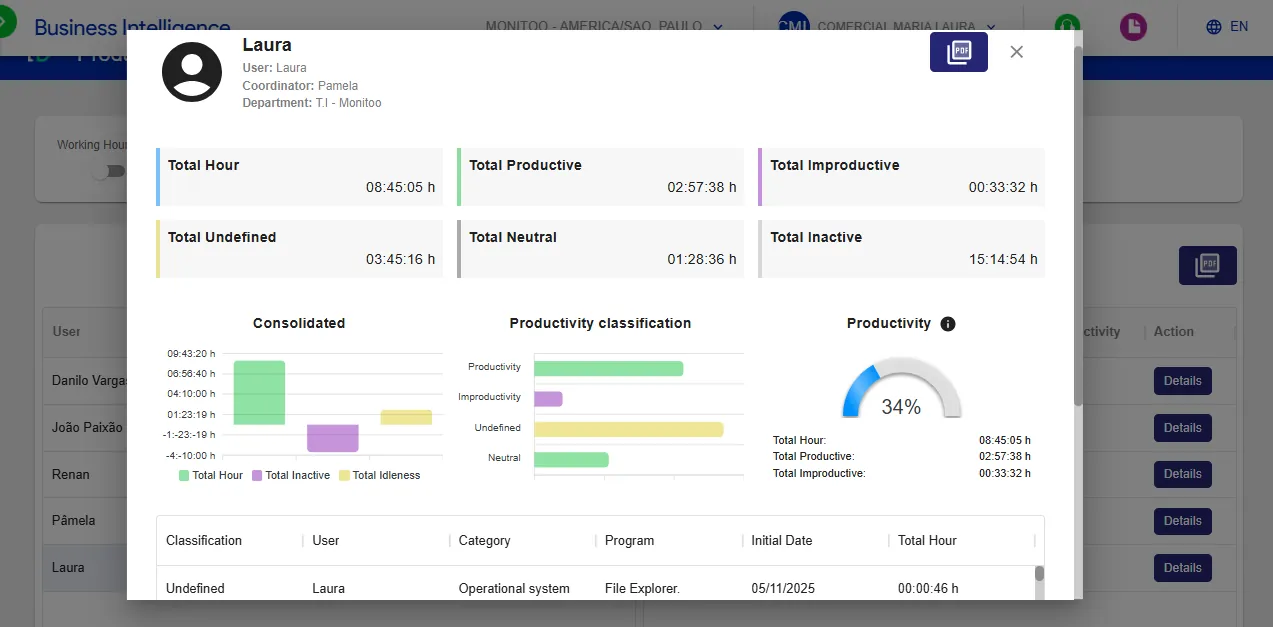
The dashboard provides a view similar to the Timeline, but with a consolidated analysis of an entire day instead of an hour-by-hour breakdown.
Productivity is calculated based on the division between Total Productive Hours and Total Hours, generating the productivity percentage.
💡 Tip: Ideal for comparing results between teams, identifying top performers, and understanding performance trends over time.
Was this article helpful?
Great! Thanks for your feedback.
Tell our team what was missing: contact support on WhatsApp.
