

We use cookies to ensure you have the best experience on our website. If you continue to use this site, we will assume that you agree with our Privacy Policies , Use Terms and cookies.

Discover insights with Monitoo’s Idleness B.I.

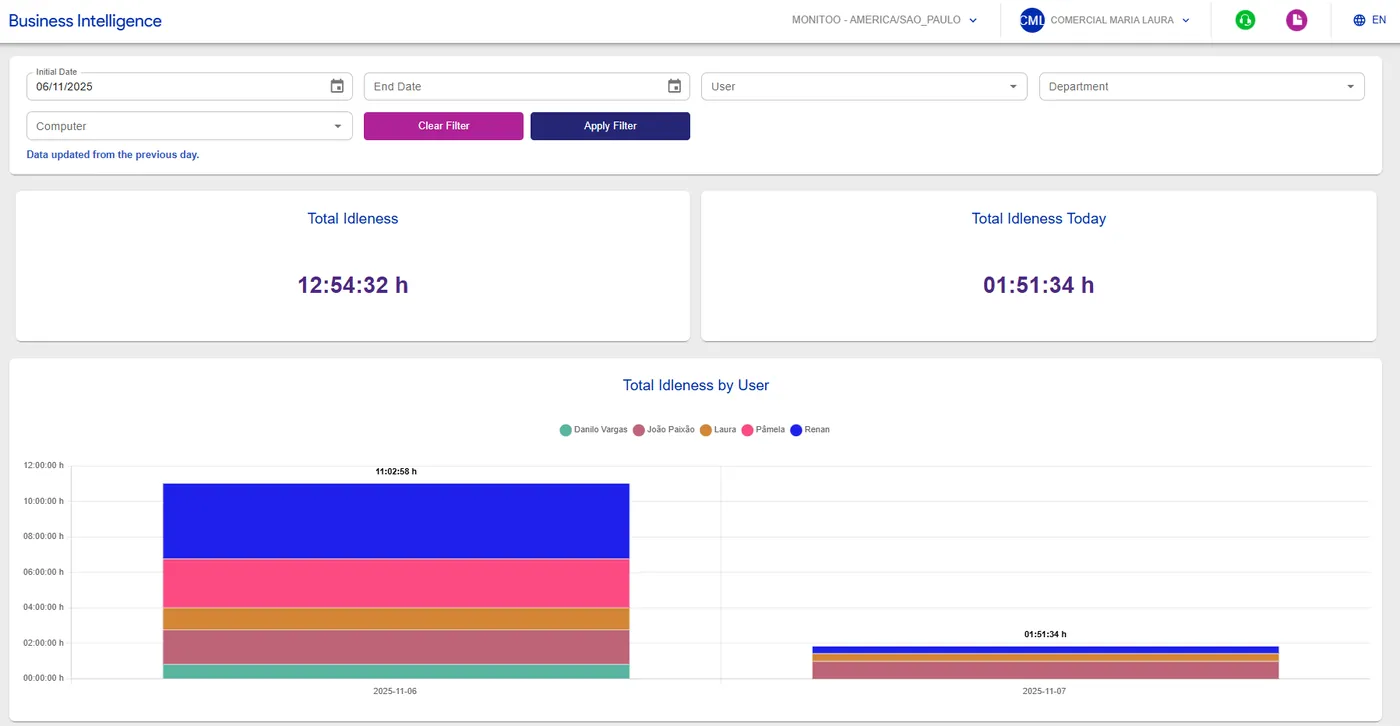
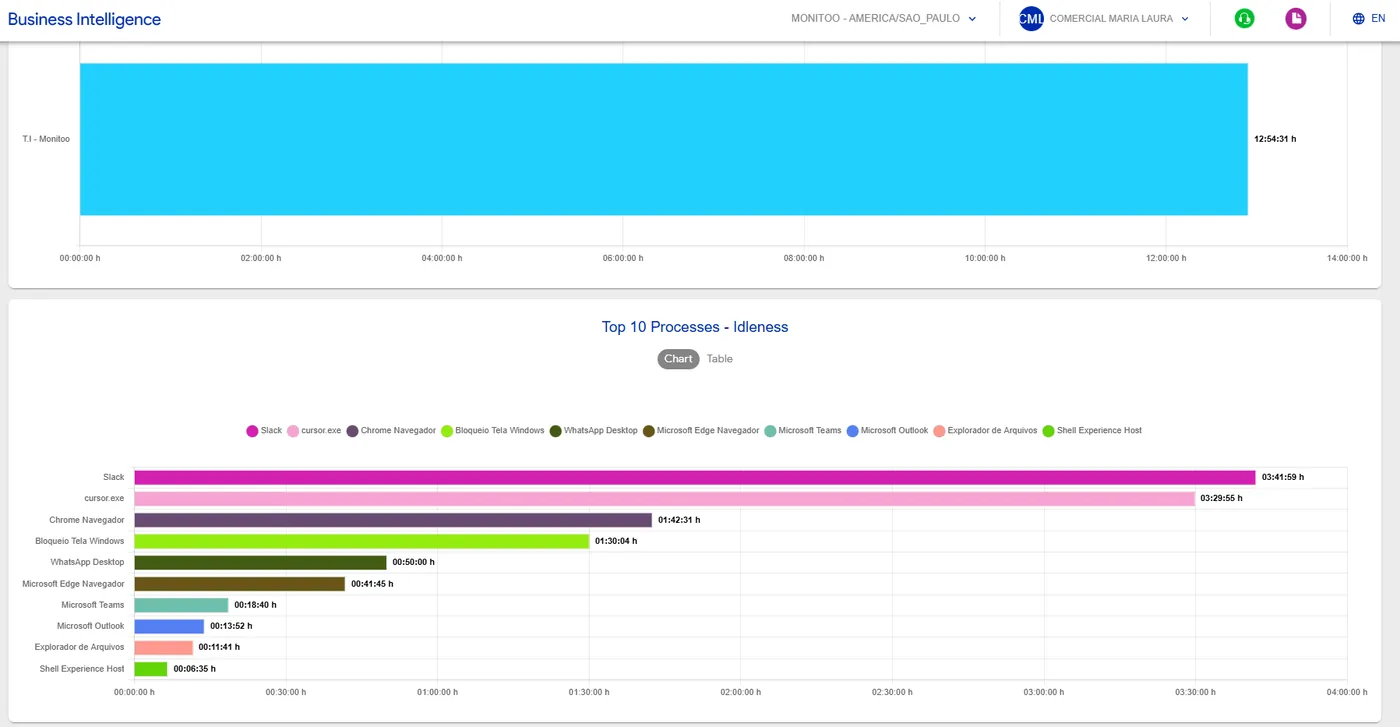
Displays the total idle time, the Top 10 most idle users, and the processes that remained inactive the longest — helping you identify opportunities for improvement.

1 minute read Updated on 18/11/2026

One of the most important dashboards for performance analysis.

It presents detailed metrics such as: total idle time by department, total idle time by user, and the Top 10 most idle processes — with data collected from the previous day.

💡 Tip: Use the Idleness B.I. to identify bottlenecks, idle periods, and opportunities for operational optimization.
Was this article helpful?

Still need help?

Didn't find what you were looking for? Talk to our team on WhatsApp and get it solved by people who know Monitoo inside and out.

WhatsApp Request free trial